


As part of the CREXDATA project, partner URV has taken a data-driven approach to one of public health’s toughest challenges: understanding how epidemics unfold and how best to stop them. At the heart of the effort is a sophisticated mathematical model designed to analyse epidemic outbreak dynamics, predict their future behaviour and run counterfactual simulations to study the effectiveness of both pharmaceutical and non-pharmaceutical interventions.
A key part of the research focuses not only on identifying strategies that work, but also on revealing when certain measures, such as poorly timed vaccinations, might lose effectiveness or even produce counter-intuitive results. By exploring these scenarios, the team aimed to shed light on the hidden mechanisms that drive unexpected epidemic behaviour. The result is a tool that supports more resilient decision making and helps public authorities plan interventions that remain effective across a range of real-world conditions.
Key contributions
- A mathematical model based on the Macroscopic Markov Chain Approach, calibrated specifically for COVID-19 with epidemiological parameters drawn from real-world outbreak data (see Fig. 1).
- A multi-patch structure, enabling the model to account for population movement patterns using the MITMA mobility dataset.
- A vaccination and waning-immunity component, allowing researchers to identify optimal vaccine distribution.
- Two scientific publications offering theoretical analyses using simplified versions of the model and outlining broad principles for effective vaccination campaigns.
- A third publication presenting a retrospective study of the Delta variant wave in Catalonia during summer 2021.
These developments provide significant insights into understanding epidemic behaviour and for designing smarter, more adaptable response strategies for future outbreaks.
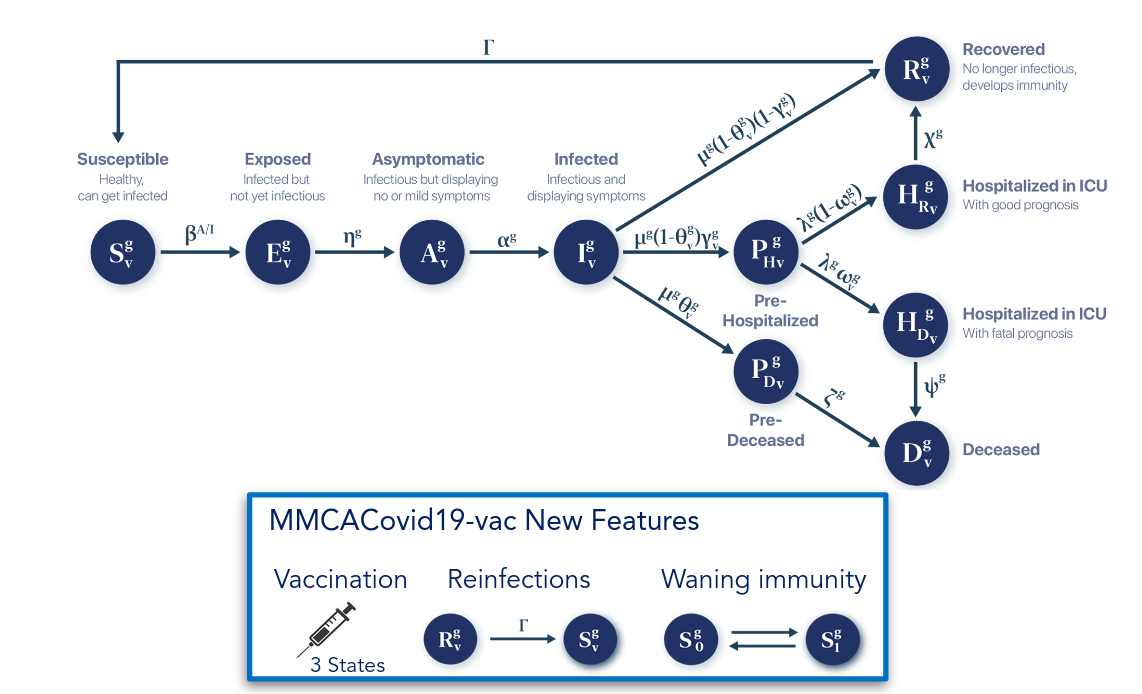
Fig. 1 The upper diagram shows the compartmental structure of the model, with each circle representing a distinct disease stage and arrows indicating the corresponding transition probability rates. Superscripts and subscripts g and v denote that a given stage or rate varies by age group and vaccination status, respectively. The lower diagram indicates the way in which the vaccination was introduced in this model: three different levels of protections and the possibility of both getting reinfected or lose your vaccine-acquired immunity
Deliverables
- The COVID19 mode can be found at https://github.com/PGcastioni/MMCA_with_vaccination
- Castioni, P., Gómez, S., Granell, C. et al. Rebound in epidemic control: how misaligned vaccination timing amplifies infection peaks. npj Complex 1, 20 (2024). https://doi.org/10.1038/s44260-024-00020-0
- Castioni, P., Arenas, A., Network-driven vaccination strategies for preventing rebound dynamics in metapopulation epidemic control, Phys. Rev. E, 111, 064315 (2025) https://doi.org/10.1103/51fg-4rhx
- Steinegger, B., Burgio, B., Castioni, et al. The spread of the Delta variant in Catalonia during summer 2021: Modelling and interpretation, Journal of Infection and Public Health 18, 102771 (2025) https://doi.org/10.1016/j.jiph.2025.102771