As Artificial Intelligence becomes more deeply embedded in critical decision-making processes, the “black box” problem -where models reach conclusions without visible reasoning- remains a major barrier to trust. To bridge this gap, the CREXDATA project has successfully integrated advanced Explainable AI (XAI) techniques.
Led by the Consiglio Nazionale delle Ricerche (CNR), the initiative has transformed complex AI outcomes into clear, actionable insights for human operators.
Technical Breakthrough: Optimizing the LORE Algorithm
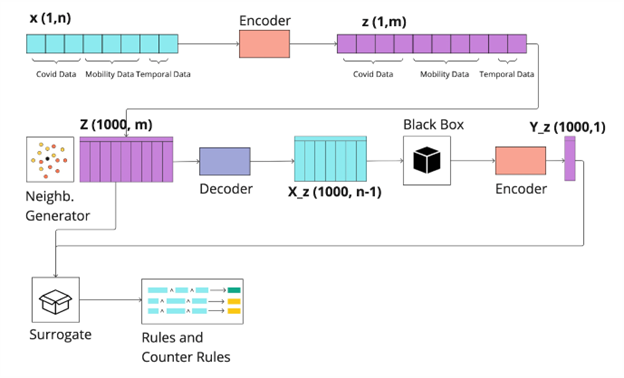
At the heart of this development is the LORE (Local Rule-Based Explanation) algorithm. Recognizing the need for real-time responsiveness in high-stakes environments, the team achieved a 10x improvement in computational speed through rigorous optimization.
Beyond speed, the system was re-engineered with fully modular architecture. This shift serves two primary technical goals:
- Knowledge Injection: It allows external domain expertise to be integrated directly into the explanation process.
- Extensibility: New generators can be “plugged in,” allowing the system to adapt to entirely new domains and ensuring the project’s long-term versatility.
Designing for the Human Brain: The Cognitive Science Approach
The project emphasizes that advanced algorithms are only useful if humans can understand them. Consequently, CREXDATA adopted an explanation paradigm grounded in cognitive science:
- Logic Rules: Outcomes are presented in a natural IF condition THEN outcome format, mirroring human reasoning.
- Contrastive Thinking: The system computes “counter-rules,” allowing users to explore hypothetical scenarios by asking, “What would happen if this variable changed?”.
- Path Summarization: For complex automata- and graph-based models, the system abstracts away minute details to provide high-level summaries of the most probable paths.
Interactive Visualization and Real-World Validation
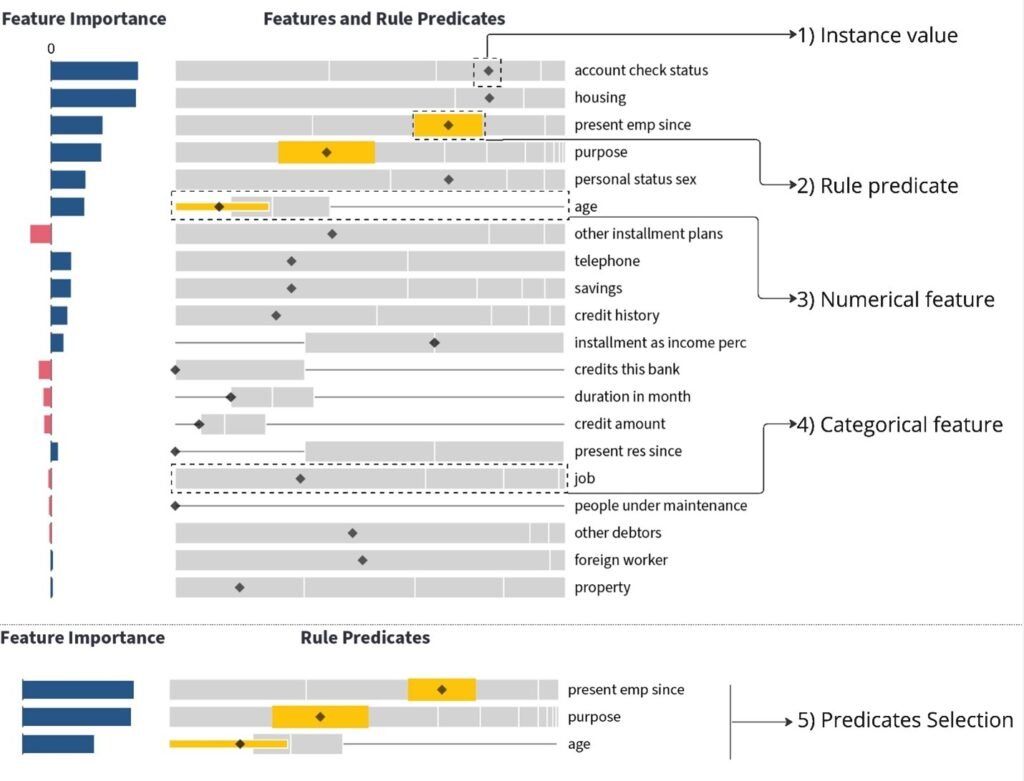
To prevent information overload, the team developed a visual interface based on a progressive disclosure approach, revealing complexity only as the user navigates deeper into the rules. A key feature is the FIPER visualization, which maps conditions against data distributions to help experts evaluate edge cases.
This interactive exploration paradigm allows analysts to challenge the “AI box” by exploring alternative hypotheses and measuring the relevance of specific observations.
The framework has been validated against actual operational data across diverse use cases, including crisis management and medical diagnostics involving both physicians and patients.
Explore the Tech: The system components and code for this XAI framework are available on the CREXDATA Public GitHub repository.