


As Artificial Intelligence (AI) increasingly handles extreme-scale data in high-stakes environments, the EU-funded CREXDATA project has announced a significant breakthrough in making these complex models more transparent and trustworthy. Researchers from the project have developed a novel framework that integrates Visual Analytics (VA) with Explainable AI (XAI), allowing domain experts to directly shape and understand the logic behind predictive models.
The Challenge: Beyond the “Black Box”
Traditional AI models often operate as “black boxes,” where the reasoning behind a prediction -such as a sudden spike in pandemic cases or a hazardous maritime maneuver- remains hidden from the human operators who need it most. While standard XAI techniques exist, they frequently produce outputs like decision trees with hundreds of nodes or massive rule sets that far exceed human comprehension capacity. Furthermore, these systems often rely solely on data-driven methods, failing to align with the established reasoning processes of domain experts.
A Two-Stage Framework for Human-Centric AI
Led by experts from Fraunhofer IAIS and the CNR, the CREXDATA team addressed this misalignment by developing a framework that incorporates domain knowledge at two critical stages of the machine learning lifecycle:
- Expert-Guided Data Structuring: Analysts use visual tools to engineer features and structure raw data before model training, ensuring the model learns concepts that are meaningful to the specific field.
- Domain-Constrained Explanations: During the explanation phase, the system generates “neighborhoods” of data that are constrained by domain logic, ensuring that the AI’s justifications are grounded in real-world feasibility.
Interactive Exploration of Model Logic
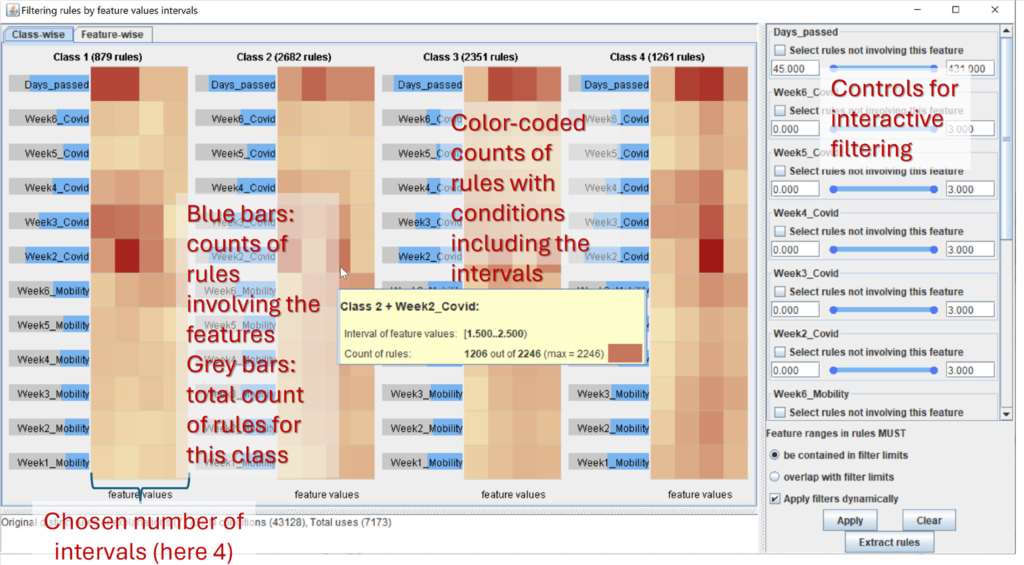
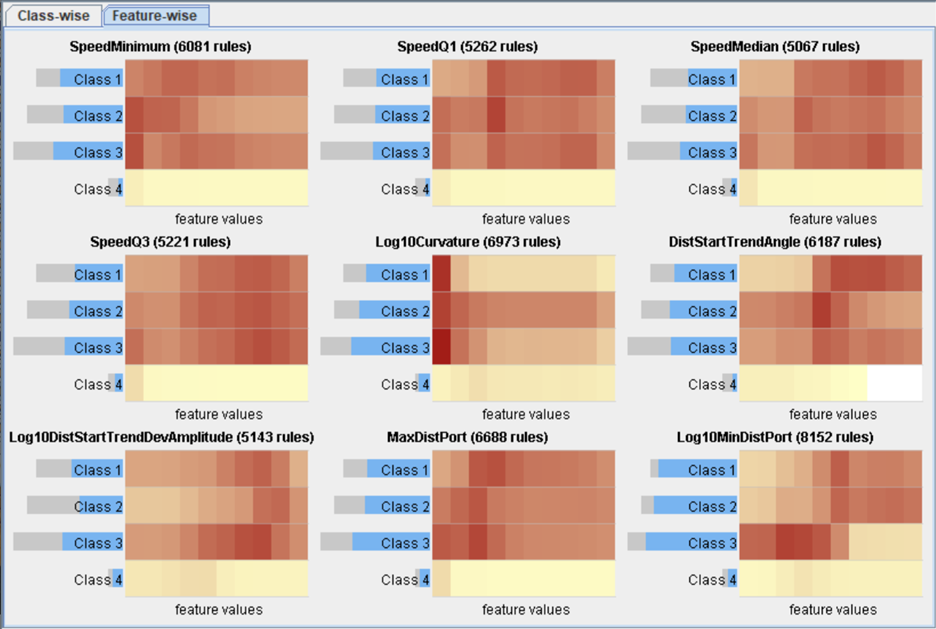
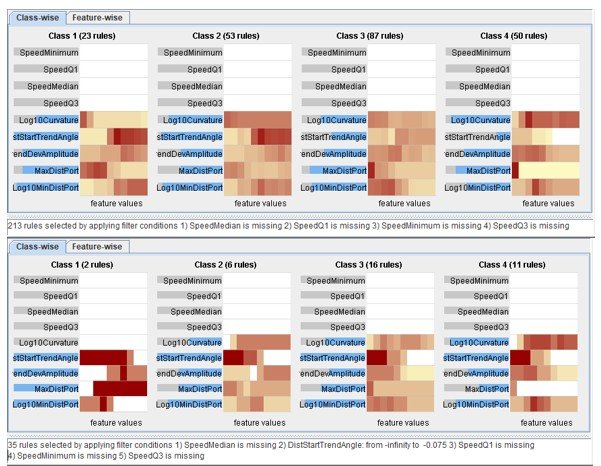
A key contribution of the project is a suite of interactive tools designed for logic-oriented exploration. Rather than presenting a static list of rules, the system allows users to:
- Filter and Summarize: Navigate from broad overviews of a model’s logic down to specific, detailed rules on demand.
- Detect Inconsistencies: Identify and refine “illogical” or contradictory rules that may arise from ensemble models, even if those models show high statistical accuracy.
- Evaluate Impact: Assess the frequency and importance of specific features -such as vessel distance or disease incidence rates- across the entire rule set.
Battle-Tested Use Cases: Health and Maritime Safety
The framework has been validated through rigorous case studies directly linked to CREXDATA’s core mission of managing extreme-scale data in real-time:
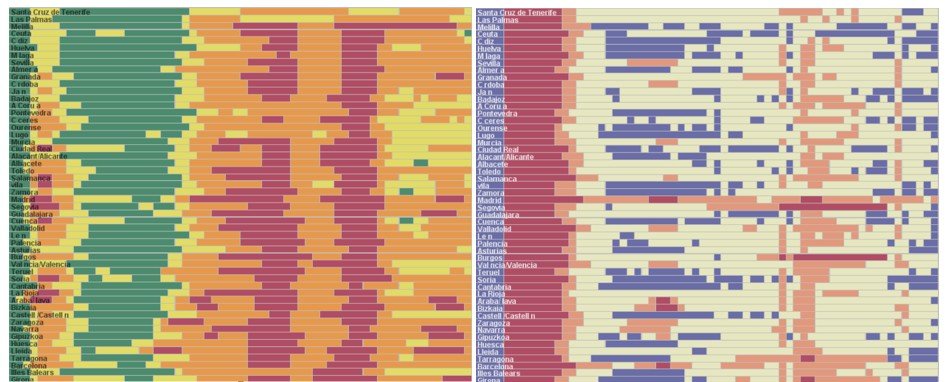
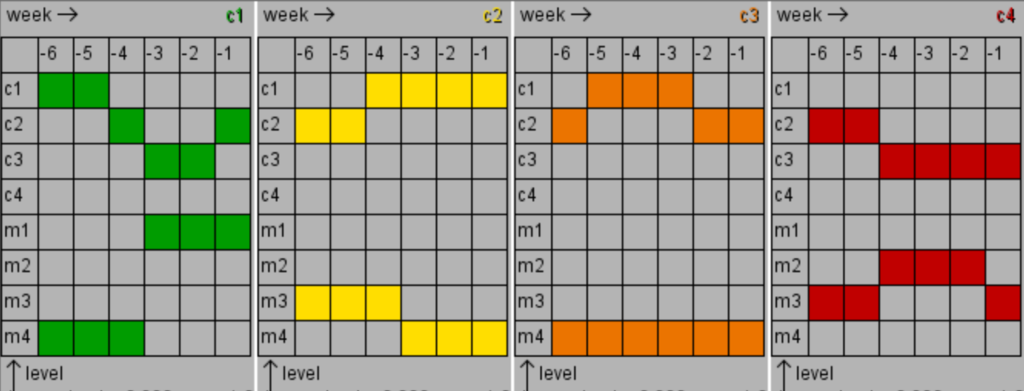
- COVID-19 Incidence Prediction: In a study involving provinces in Spain, researchers used the tool to transform complex time-series data into sequences of classified events (e.g., population mobility and disease levels), allowing health officials to visually validate the logic used to predict infection surges.
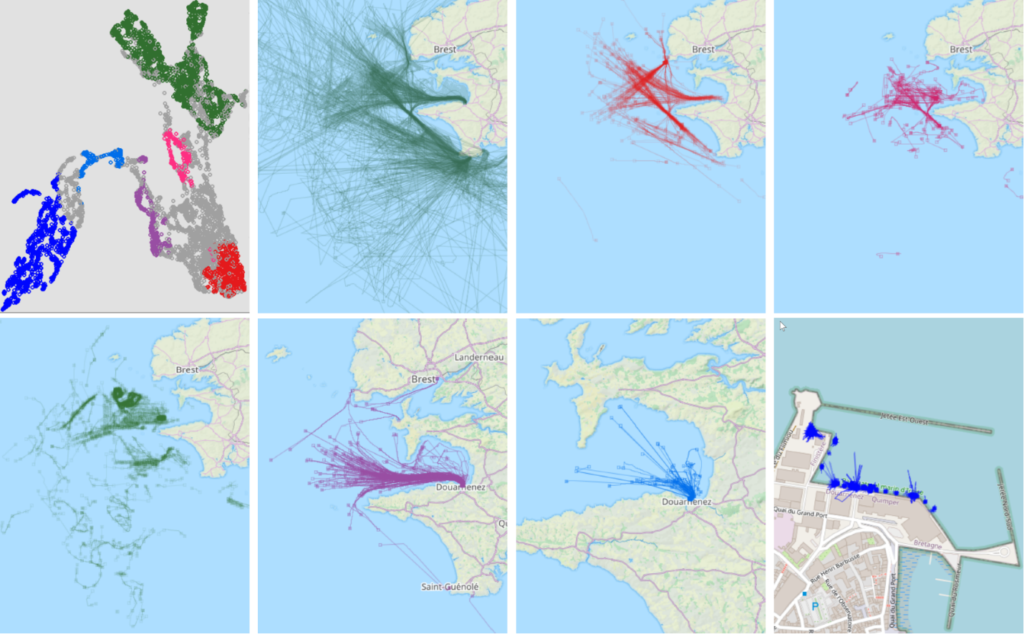
- Vessel Movement Patterns: For the maritime sector, the framework was used to recognize patterns in vessel trajectories. By visualizing feature distributions like trend angles and distances, operators can detect and mitigate hazardous situations at sea with greater confidence.
Outlook: Trustworthy AI for Future Crises
CREXDATA continues to refine these tools to support proactive decision-making in weather emergencies, health crises, and maritime operations. By placing the human expert back in the loop, the project is ensuring that the next generation of AI is not only powerful but also interpretable, reliable, and fundamentally aligned with human expertise.


References
Natalia Andrienko, Gennady Andrienko, Alexander Artikis, Periklis Mantenoglou, Salvatore Rinzivillo
Human-in-the-Loop: Visual Analytics for Building Models Recognising Behavioural Patterns in Time Series
IEEE Computer Graphics & Applications , 2024, vol. 44(3), pp.14-29
published version: https://doi.org/10.1109/MCG.2024.3379851
Eleonora Cappuccio, Bahavathy Kathirgamanathan, Salvatore Rinzivillo, Gennady Andrienko, Natalia Andrienko
Integrating human knowledge for explainable AI
Machine Learning , 2025, vol. 114, paper 250
published version: https://doi.org/10.1007/s10994-025-06879-x (open access)
Linara Adilova, Michael Kamp, Gennady Andrienko and Natalia Andrienko
Re-interpreting Rules Interpretability
International Journal of Data Science and Analytics , 2025, vol. 20(1), pp.25-45 (accepted and published online in 2023)
published version: https://doi.org/10.1007/s41060-023-00398-5 (open access)